I just wanted to share with you some of the things I have been doing recently. If you’re familiar with my work, you might want to scroll down a bit. There’s a bit of intro below just to set the scene properly for the new readers. My apologies if it sounds a bit repetitive.
A brief intro to the evolution of oxygenic photosynthesis
When we think about the origin of oxygenic photosynthesis, we usually ask: when did Cyanobacteria originate? We usually equal the origin of Cyanobacteria with the origin of oxygenic photosynthesis and so when we think about the early evolution of life, there is no reason to suppose that oxygenic photosynthesis could have played any role at all in the initial stages of the evolution of bioenergetics or in the origin of life.
When we think about it that way, then it is quite reasonable to suppose that the more closely related clades to Cyanobacteria: Margulisbacteria, Sericytochromatia, and Vampirovibrionia (Melainabcateria) were never capable of photosynthesis, and even less so, of oxygenic photosynthesis. The idea that the most recent common ancestor (mrca) of Bacteria could have been capable of oxygenic photosynthesis would seem, to most, laughable.
When I think about the origin of oxygenic photosynthesis. I think something else, I think of a chemical reaction, not of a group of organisms. I think of the light-driven oxidation of water to oxygen. I think of Photosystem II. So I asked instead: when did water oxidation originate? Or how did Photosystem II evolve water oxidation photochemistry?
We know that the mrca of Cyanobacteria was capable of oxygenic photosynthesis and had a Photosystem II, which has changed very little in mechanism and structure. So then I wondered, what is the span of time between the origin of water oxidation and the mrca of Cyanobacteria?
When I tried to answer this question I set off on a journey of discovery that took me to places that I could have never anticipated… not even in my wildest sciency dreams.
The reaction centre core of Photosystem II is made up of two subunits, D1 and D2, which originated from a gene duplication event. And these two are associated respectively with the antenna subunits CP43 and CP47, which also originated from a duplication event. At a structural level, D1 and D2, are almost identical, and therefore we can conclude with a pretty good deal of confidence that before the duplication, the ancestral Photosystem II was not only architecturally very similar to what it is now, but also it was capable of water oxidation (Cardona, Sanchez-Baracaldo et al. 2019).
Even if for some bizarre reason I, and my colleagues, have misinterpreted all of the conserved traits between D1 and D2 that are involved in water oxidation or in the protection against reactive oxygen species… which are actually quite a few; even if it turns out that these conserved traits were not actually involved in water oxidation, it is however undeniable that this photosystem, before duplication, was nothing like the anoxygenic Type II photosystem used by purple (Proteobacteria) and green non-sulfur bacteria (Chloroflexi).
Even if we chose to ignore those conserved traits, the pre-duplication photosystem was, well on its way to the evolution of water oxidation and was already more oxidizing than any other photosystem known.
I had to formulate the origin of oxygenic photosynthesis, not in terms of when Cyanobacteria originated but in terms of the span of time between the duplication leading to D1 and D2, and the mrca of Cyanobacteria.
The main result of this investigation was that this span of time, let’s call it ΔT, is very large (Cardona, Sanchez-Baracaldo et al. 2019). It is so large that I feel embarrassed talking about it. I confess it. It makes me feel deeply uncomfortable.
As crazy as it might sound, ΔT could be easily, over a billion years.
Why is that? There is a very good reason for it. That D1 and D2 are evolving very slowly, but they are actually quite distant from each other: in other words, they have changed a lot relative to each other at the sequence level, even though at the structural 3D level they are almost identical. So, at a very slow rate of change, it means that it takes a lot of time to span that distance, the amount of change that have occurred since duplication, when D1 and D2 were 100% identical, and the mrca of Cyanobacteria, when D1 and D2 had already changed by more than 70%.
The rates of evolution of D1 and D2 are so slow that even if ΔT is a billion years, very fast rates of evolution are needed at the point of duplication, it does not matter when in the Archean or Hadean this duplication occurred. The rate then decreases exponentially to current levels in the late Archean.
We have to shift now from the discussion on the origin of oxygenic photosynthesis to a discussion of the rates of evolution. It is all about the rates.
Rates of evolution
Imaging that a protein evolves at 1 amino acid change per site per billion years. That means that if two identical sequences evolve at this rate, and every position in the sequence evolves at the same rate, then we would expect that in about a billion years, there will be no sequence identity left between the two.
Then, if a protein evolves at 10 amino acid changes per site per billion years, that means that in 1 billion years every position would have changed about 10 times. It means that it would take only 100 million years for two identical sequences to lose all sequence identity.
If a protein evolves at 0.1 amino acid changes per site per billion years, that means that it would take 10 billion years for two sequences to lose all sequence identity.

A comparison of the rates of evolution of different proteins. Those in black I have calculated myself. Those in grey I have taken from the literature. A larger list of rates reported as amino acid changes per site per billion years can be found in (Cardona, Sanchez-Baracaldo et al. 2019). The blue line at 1 subs./site/Ga marks the rate at which two identical sequence would lose all sequence identity after 1 billion years. The region marked in orange marks the predicted rates of evolution at the point of duplication of those ancient proteins.
That is my simplistic way to think about protein rates of evolution through time. In reality it is a bit more complicated than that, and rates of evolution vary per site, and from organism to organism, and certain evolutionary pressures can accelerate or decelerate the rates of evolution… but in any case, I think these simple scenarios can help us get our heads thinking in terms of rates of evolution. The way molecular clocks estimate rates is also rather complicated, and I don’t want to say obscure… at least that’s how it seems to me though, just an average biologist.
OK. There are a bunch of enzymes that we think are very ancient and could have existed in the last universal common ancestor (LUCA). For example, some of the ribosomal proteins or some of the subunits of ATP synthase. They are highly conserved through life, meaning that they evolve slowly.
If we consider that the LUCA could be 3.8 or even more than 4.0 billion years old, for a protein that originated before the LUCA to have retained a significant level of sequence identity today between two distant organisms, say a bacterium and an archaeon; then the rate of evolution has to have remained low for billions of years, say well below 1 amino acid change per site per Ga (subs./site/Ga). Even if fluctuations in the rates have occurred or if one particular lineage has evolved faster than another.
So, if we look at the level of sequence identity between two organisms, and we know more or less how old they are, we can then figure out the rate of protein evolution. Thus, if two related protein evolve fast, they will lose sequence identity faster, than two relatively slower evolving proteins.
It turns out that D1 and D2 are REALLY slow evolving, even if we consider the mrca of Cyanobacteria to be as young as 2.0 billion years old, even if we consider it to be 1.5 billion years old. In fact, D1 and D2 could be one of the slowest evolving proteins in the history of life. They evolve even more slowly than ATP synthase subunits alpha and beta, which are thought to have originated before the LUCA!
If we take any two pair of species of Cyanobacteria or photosynthetic eukaryotes and compare the level of sequence identity, we will find that almost without exception, D1 and D2 always retain greater sequence identity when compared to their respective orthologues, than alpha and beta.
The funny thing is that these relationship seem to extend to the duplication event too. This should not be the case AT ALL if PSII was hundreds of millions of years, if not a billion years or more, younger than ATP synthase… as you would expect from traditional evolutionary scenarios.
If we compare the level of sequence identity between D1 and D2, it’s under 30%, and between alpha and beta, about 20%. The slightly faster evolving alpha and beta have lost slightly more sequence identity, than the relatively slower evolving D1 and D2. And now, if we compare CP43 and CP47, that evolve a little bit faster than D1 and D2, and more like alpha and beta, guess what… yeah, the level of sequence identity between CP43 and CP47 is about 20% too.
Therefore, like D1 and D2, the duplications leading to alpha and beta, and CP43 and CP47 also require exponential decreases in the rates of evolution.
I have calculated that the rate of evolution of D1 and D2 is on average about 0.12 subs./site/Ga, this is in an scenario in which the mrca of Cyanobacteria actually post-dated the Great Oxidation Event, which I believe is the result of an overestimation of the rates of evolution (the rates appear faster than they should be). So, in reality, D1 and D2 are probably evolving slower than 0.12 subs./site/Ga. It is not a weird result, because as you know, D1 and D2 have hardly changed since the mrca of Cyanobacteria.
Thus in an scenario in which ΔT is slightly over a billion years, then the rate of evolution at the point of duplication would need to be about 5.0 subs./site/Ga, which is pretty damn fast. As expected, CP43/CP47 and alpha/beta, behave exactly in the same way.
This is the thing, that there are no many proteins that are known to evolve at 5.0 subs./site/Ga. Believe me, I have tried to compile a list. In other words, proteins of this type, with complex functions and chemistry, with complex regulation, with many protein-protein interactions, proteins that bind cofactors in preciase orientations and distances, do not evolve at such high rates. The problem is that if we make ΔT smaller, then even higher rates would be required at the point of duplication.
But how do I know that D1 and D2 have not evolved at rates greater than 5.0 subs./site/Ga before the mrca of Cyanobacteria?
This is when the structural comparisons become really helpful. D1 and D2 are related to the L and M subunits of the Type II reaction centres of Proteobacteria and Chloroflexi. L and M originated from a duplication that is different to that which led to D1 and D2. I have found that L and M are evolving at about 5x faster rates than D1 and D2.
If D1 and D2 have always evolved slower than L and M, then we would expect that D1 is more similar to D2, than L is to M. We would also expect that D1 and D2, would retain more ancestral traits than L and M. And that is exactly the case.
D1 and D2 have retained greater sequence identity than L and M, and greater structural symmetry, they also retain a number of features that are found in their more distantly related Type I reaction centres, which are not found any more in L and M.
So it does not seem that at any point in time D1 and D2 were evolving faster than L and M, which therefore rules out the possibility that they have actually experienced sudden accelerations in the rates of evolution that would surpass 5.0 subs./site/Ga. It actually feels to me that 5.0 subs./site/Ga is an overestimation. Meaning that ΔT could be even larger.
It gets really interesting.
Evolution of bacteria
I ask then, what is the span of time between the divergence of Vampirovibronia, Sericytochromatia, or Margulisbacteria, and the mrca of Cyanobacteria?
What is the span of time between the mrca of Bacteria and that of Cyanobacteria? Is it greater than 1.0 billion years?
What is the span of time between the LUCA and the mrca of Cyanobacteria?
It has been suggested before that Bacteria actually expanded quite rapidly in the Archean (David and Alm 2011)… so… what does that mean? Right? ΔT.

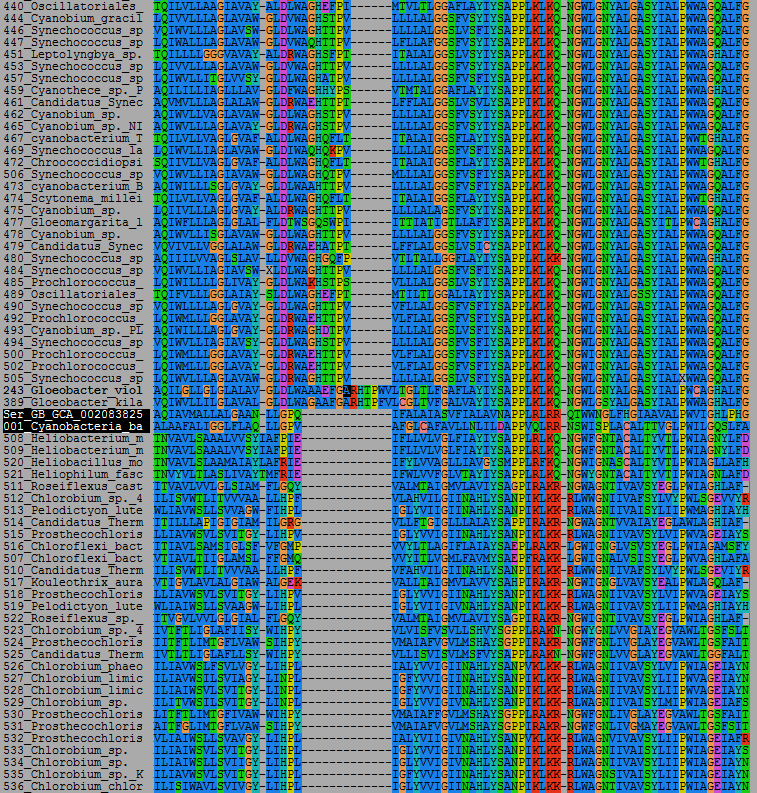
A molecular clock of D1 and D2 at the top, and RpoB at the bottom. The mrca of Cyanobacteria inherited D1 and D2, but there is a large phylegenetic distance between these two. This is large enough to contain the distance between the mrca of Cyanobacteria and most other clades of Bacteria, most certainly Margulisbacteria, Sericytochromatia, and Vampirovibronia.
I have been experimenting now with some large molecular clocks of the RNA polymerase subunit B in bacteria. This is a very large protein, highly conserved across all life, usually more the 50% conservation of sequence identity between distantly related species. A very well-behaved protein!
The tree above was built using a dataset of over 350 sequences with about 900 well-aligned positions. I have included phyla that contain phototrophs and some of their non-photosynthetic relatives.
I am not really interested in having a huge dataset with hundreds of concatenated genes and thousands of species.
What I want is to be able to have a good understanding of the sequences that I am putting into my clocks. I want to be in control so that I can understand why I get whatever result I get. I want to have a clear understanding of how variations in the molecular clock parameters and calibrations will affect the estimated rates. For example, does the calculated rate of evolution of RpoB in a given set of organisms, match the actual rates that are expected from the level of observed sequence change? Do they match real rates?
Let me provide a more specific example:
Termititenax is a newly described genus of Margulisbacteria (Utami, Kuwahara et al. 2019). It is an ectosymbiont of a bacterium that lives inside a protist that lives in the gut of termites and cockroaches. The level of sequence identity of RpoB in two closely related species of Termititenax is 70%. These two sequences cluster next to each other in the tree above. If we compare the level of sequence identity of the same protein between two species of Nostoc, a heterocystous cyanobacterium, the level is 95%. So roughly, I expect that the rate of evolution of RpoB in Termititenax should be about 6x faster than the rate in Nostoc… if they are at the same taxonomic rank.
That means that RpoB in Termititenax is evolving much faster than RpoB in Nostoc.
Indeed, if we compare RpoB of Gloeobacter, the earliest branching cyanobacterium, and any other strain of Cyanobacteria, the level of sequence identity is not lower than 85%. That means that the rates of evolution of RpoB in all strains of Cyanobacteria should always be below that of Termititenax.
Similar patterns of evolution can be seen across Bacteria, in particular between lineages made up mostly of free-living strains and those made up of (endo)symbionts that have experienced genome size reductions.
Knowing that, when I check the outputs of my clock, I can then find out whether the estimated rates of evolution actually make some sense or not. At least, within certain points of interest or reference…
The accuracy of a molecular clock depends on the accuracy of the estimation of the rates of evolution, which therefore requires the accurate use of calibrations. Calibrating molecular clocks of prokaryotes is notoriously difficult, as they do not leave behind an unambiguous fossil record. However, that is not going to stop me or deter me! I rather fail trying than not trying at all.
To overcome this problem, I have been exploring new set of calibrations, which in the spirit of open access, I shall share with you below.
The above tree has 12 calibrations, 8 of which have not been tried before.
These are:
1. Termititenax, Margulisbacteria, symbiont of termites and cockroaches. The authors who characterized these strains provided evidence that these symbiotic associations has likely been passed down since the mrca of the group that includes termites and cockroaches.
2. The margulisbacterium symbiont of the placozoan Trichoplax, an early evolving animal. This association has also been shown to be conserved between most, if not all, studied and globally distributed placozoans.
3. The divergence between the strains of Gastranaerophilales Vampirovibronia found in the gut of humans and koalas.
4. The mrca of the group including the predatory bacterium Vampirovibrio chlorellavorus, and Gastranaerophilales. Vampirovibrio chlorellavorus specifically eats Chlorella, a photosynthetic Eukaryote; and Gastranaerophilales are the symbionts of the gut, so the ancestor of this specific group should not be older than eukaryotes.
5. The Bradyrhizobium. Alphaproteobacteria in specific association with legumes.
6. Polynucleobacter necessarius. Betaproteobacteria: a specific symbiont of the ciliate Euplotes and their closest relatives.
7. The Wolbachia symbionts of insects and other arthropods.
8. And the Rickettsiales themselves, which have basically evolved to exist in symbiosis with eukaryotes. In fact, some claim that the mitochondria was a Rickettsiales… so there could actually be some continuity here.
The other four calibrations are the traditional ones. The specific biomarkers of Chlorobi and Chromatiales, heterocystous cyanobacteria, and the fossil cyanobacteria Eoentophysalis belcherensis of the Gunflint fossil stromatolites, claimed to be the oldest unambiguous fossil of cyanobacteria.
The important point here is that we will not get good results if both fast and slowly evolving lineages are not calibrated. If all calibrations fall on fast evolving lineages, the rates of slow evolving lineages will likely be overestimated. Thus the slow evolving lineages will appear to be younger than they really are. If only slow evolving lineages are calibrated, then the ages of the fast evolving lineages will be underestimated. Thus the fast evolving lineages will apear to be older than they really are.
If you want to discuss these new calibrations, get additional references on these symbiotic relationships, and the exact timings that I have chosen for each point. Please let me know! If these spark some ideas of potential calibrations of the same sort, let me know!
I have now ran many clocks testing the effects of different calibrations and I think they actually perform pretty well.
The tree above is an example of a clock that I think is pretty reasonable. It was run with an autocorrelated log normal clock, with the CAT model. The root prior was set to be 3.8 ± 0.5 Ga. So quite broad. The scale bar represents 1.0 Ga and I have not shown the confidence intervals because of convenience and clarity.
The span of time between the mean age of the root, which in this case corresponds to the divergence of Thermotoga, and the mrca of Cyanobacteria, is 850 Ma. The span of time between the divergence of Vampirovibronia and the mrca of Cyanobacteria was 412 Ma, which is within the same range of what have been proposed before (Shih, Hemp et al. 2017, Magnabosco, Moore et al. 2018). I think it was suggested to be between 150 and 500 Ma in the referenced papers. I also found a span of time between the divergence of Margulisbacteria and Cyanobacteria of 633 Ma.
However, the 95% confidence intervals for the divergence of Vampirovibronia/Margulisbacteria and Cyanobacteria overlapped! So that means that the span of time between these could actually be as short as no time at all.
The exact dates are not that important really: in the rates is where the real information is!
Let us have a look at the node (instant) rates of evolution of D1 and D2 in comparison with those of RpoB. You can see that like D1 and D2, RpoB also shows an exponential decrease in the rates of evolution! See the plots below.

Comparison of the instant rate of evolution of D1 and D2 (left) and RpoB (right) of an autocorrelated clock. An exponential decrease in the rates of evolution is observed in both cases. These are just two examples, in this particular case, for D1 and D2 the tree was calculated assuming an origin of Type II reaction centres at about 3.8 Ga, which places the D1 and D2 duplication at about 3.6 Ga, making ΔT, well over 1 Ga. Even like that, an exponential decrease in the rates is necessary. The shorter ΔT, the faster the rate at the point of duplication.
On the RpoB plot, the rates on Cyanobacteria are shown in dark grey, and those of the Margulisbacteria/Sericytochromatia/Vampirovibronia (MSV) are shown in light grey. The coloured dots represent the rates at the same nodes marked in the tree.
Overall, it becomes clear than the MSV are evolving somewhat faster than Cyanobacteria. Especially around the 1.5 to 3.0 Ga sector. When I compared the rate of evolution between Termititenax and Nostoc, the former was found to be evolving ~4.9 faster than the latter, consistent with the observed distances. Not too bad.
I have the feeling however that the rates determined for Cyanobacteria are still an overestimation (faster than they should be) and those of MSV are being underestimated (slower than they should be).
That is because, the oldest nodes in the Cyanobacteria tree appear to be substantially faster than what you find in younger nodes, which I find unrealistic, given that the earliest branching Cyanobacteria are not known for being fast evolving. In this particular tree, the mrca of Cyanobacteria is at 2.72 Ga, with 95% CI of 2.44 to 3.0 Ga. I should say that I did not use the Great Oxidation Event as calibration, and the node representing the mrca of Cyanobacteria was not calibrated.
At the same time, the nodes in Margulisbacteria and Vampirovibrionia, which live in association with Eukaryotes seem much older than they should be. For example, the mrca of Gastranaerophilales is timed at 2.32 Ga with a 95% CI of 1.91 to 2.74 Ga, which I find quite unrealistic as well, as these are gut symbionts. As it is the case for Termititenax, the level of divergence of the Gastranaerophilales sequences are very large in comparison with other bacteria, which is a strong indication of faster rates of evolution. I do not find that unusual given their lifestyle, but it has implications.
So, I suspect that the calculated rates of evolution of Cyanobacteria are too fast, and those of MSV are too slow. This means that probably the span of time between the MSV divergences and the mrca of Cyanobacteria is likely much shorter than 400 Ma.
I have tried now many different models, adding and removing calibrations, varying root priors and root conditions, etc., etc. I suspect that the “relaxed” nature of the clocks, which tends to “smooth” or “equilibrate” the rates of evolution between lineages is the reason for that effect. I suppose this is fine if one is applying the clock on organisms that are closely related: say arthropods, or land plants, but it is not good for prokaryotes… I believe.
On that note, the uncorrelated gamma model: I’m not sure that it works that well... it seems to me it does not generate realistic results, but it is hard to tell given the way the rates are computed for this model. Also, if I use the “soft bounds” option on the autocorrelated model, which is like a “hyper relaxed” clock, I get even less plausible results. In any case, all of this is preliminary and I am currently scrutinizing these results in detail…
But we have not addressed the elephant in the room yet.
Yes, the evolution of D1 and D2: ΔT.
The span of time between the duplication of D1 and D2, and the mrca of Cyanobacteria is too large. In fact, it can be larger than the distance between the root and mrca of Cyanobacteria in that particular example.
If we say that the span of time between D1 and D2 is 400 Ma, that would require rates at the point of duplication in the order of 13 subs./site/Ga. I think that would be rather unlikely, given what I discussed above.
I would like to think that the divergence of Bacteria and Archaea had something to do with the exploitation of chlorophyll-based photochemistry, likely oxygenic, in Bacteria; and the emergence of methanogenesis in Archaea.
I know it sounds crazy, but I just cannot ignore the data. I hypothesize now that there was never a discrete time for the origin of oxygenic photosynthesis, but that the process emerged from oxidative photochemical reactions during abiogenesis that could have resulted in the oxidation of water at a very early stage during the establishment of bioenergetics.
I would appreciate discussing this in greater detail, so please email me if you want to collaborate, to give me some feedback, to point out terrible flaws in my rationales, or if you have any questions.
References
Cardona, T., P. Sanchez-Baracaldo, A. W. Rutherford and A. W. D. Larkum (2019). "Early Archean origin of Photosystem II." Geobiology 17(2): 127-150.
David, L. A. and E. J. Alm (2011). "Rapid evolutionary innovation during an Archaean genetic expansion." Nature 469(7328): 93-96.
Magnabosco, C., K. R. Moore, J. M. Wolfe and G. P. Fournier (2018). "Dating phototrophic microbial lineages with reticulate gene histories." Geobiology 16(2): 179-189.
Shih, P. M., J. Hemp, L. M. Ward, N. J. Matzke and W. W. Fischer (2017). "Crown group Oxyphotobacteria postdate the rise of oxygen." Geobiology 15(1): 19-29.
Utami, Y. D., H. Kuwahara, K. Igai, T. Murakami, K. Sugaya, T. Morikawa, Y. Nagura, M. Yuki, P. Deevong, T. Inoue, K. Kihara, N. Lo, A. Yamada, M. Ohkuma and Y. Hongoh (2019). "Genome analyses of uncultured TG2/ZB3 bacteria in 'Margulisbacteria' specifically attached to ectosymbiotic spirochetes of protists in the termite gut." Isme Journal 13(2): 455-467.